|
900
|
How can I prevent a link to end to a specified bar
with thisform.G2antt1
	.BeginUpdate
	.Columns.Add("Tasks")
	with .Chart
		.AllowLinkBars = .T.
		.LevelCount = 2
		.PaneWidth(0) = 160
		.FirstVisibleDate = {^2005-6-20}
	endwith
	with .Items
		h = .AddItem("Not-End-Linkable")
		.AddBar(h,"Unknown",{^2005-6-21},{^2005-6-28})
		.ItemBar(h,"",31) = .F.
		.AddBar(.AddItem("Task 1"),"Task",{^2005-6-23},{^2005-6-27},"")
		.AddBar(.AddItem("Task 2"),"Task",{^2005-6-23},{^2005-6-27},"")
	endwith
	.EndUpdate
endwith
|
|
899
|
How can I prevent a link to start from a specified bar
with thisform.G2antt1
	.BeginUpdate
	.Columns.Add("Tasks")
	with .Chart
		.AllowLinkBars = .T.
		.LevelCount = 2
		.PaneWidth(0) = 160
		.FirstVisibleDate = {^2005-6-20}
	endwith
	with .Items
		h = .AddItem("Not-Start-Linkable")
		.AddBar(h,"Unknown",{^2005-6-21},{^2005-6-28})
		.ItemBar(h,"",30) = .F.
		.AddBar(.AddItem("Task 1"),"Task",{^2005-6-23},{^2005-6-27},"")
		.AddBar(.AddItem("Task 2"),"Task",{^2005-6-23},{^2005-6-27},"")
	endwith
	.EndUpdate
endwith
|
|
898
|
How can I prevent a specified bar to be linked
with thisform.G2antt1
	.BeginUpdate
	.Columns.Add("Tasks")
	with .Chart
		.AllowLinkBars = .T.
		.LevelCount = 2
		.PaneWidth(0) = 160
		.FirstVisibleDate = {^2005-6-20}
	endwith
	with .Items
		h = .AddItem("Not-Linkable")
		.AddBar(h,"Unknown",{^2005-6-21},{^2005-6-28})
		.ItemBar(h,"",32) = .F.
		.AddBar(.AddItem("Task 1"),"Task",{^2005-6-23},{^2005-6-27},"")
		.AddBar(.AddItem("Task 2"),"Task",{^2005-6-23},{^2005-6-27},"")
	endwith
	.EndUpdate
endwith
|
|
897
|
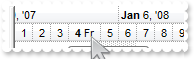
How can I display in the chart's header only days where the week starts
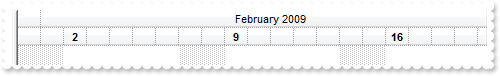
with thisform.G2antt1
	with .Chart
		.PaneWidth(0) = 0
		.FirstVisibleDate = {^2009-1-31}
		.LevelCount = 2
		.FirstWeekDay = 1
		with .Level(0)
			.Label = "<%mmmm%> <%yyyy%>"
			.Alignment = 1
			.Unit = 16
		endwith
		with .Level(1)
			.Unit = 4096
			.FormatLabel = " (0:=weekday(dvalue)) = 1 ? '<b>' +value : '' "
		endwith
		.UnitWidth = 23
	endwith
endwith
|
|
896
|
Is there any automatically way to display and change the bar's duration in the columns section
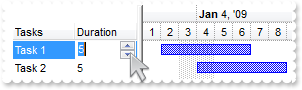
with thisform.G2antt1
	.BeginUpdate
	.MarkSearchColumn = .F.
	with .Columns
		.Add("Tasks")
		with .Add("Duration")
			.Def(18) = 513
			.Editor.EditType = 4
		endwith
	endwith
	with .Chart
		.LevelCount = 2
		.FirstVisibleDate = {^2009-1-1}
	endwith
	with .Items
		.AllowCellValueToItemBar = .T.
		.AddBar(.AddItem("Task 1"),"Task",{^2009-1-2},{^2009-1-7})
		.AddBar(.AddItem("Task 2"),"Task",{^2009-1-4},{^2009-1-9})
	endwith
	.EndUpdate
endwith
|
|
895
|
How can I programatically move or resize a bar using spin or slider controls in the columns
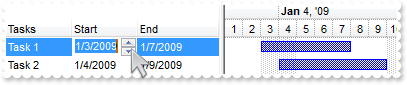
with thisform.G2antt1
	.BeginUpdate
	.MarkSearchColumn = .F.
	with .Columns
		.Add("Tasks")
		with .Add("Start")
			.Def(18) = 1
			.Editor.EditType = 4
		endwith
		with .Add("End")
			.Def(18) = 2
			.Editor.EditType = 4
		endwith
	endwith
	with .Chart
		.LevelCount = 2
		.ShowEmptyBars = 1
		.FirstVisibleDate = {^2009-1-1}
	endwith
	with .Items
		.AllowCellValueToItemBar = .T.
		.AddBar(.AddItem("Task 1"),"Task",{^2009-1-2},{^2009-1-7})
		.AddBar(.AddItem("Task 2"),"Task",{^2009-1-4},{^2009-1-9})
	endwith
	.EndUpdate
endwith
|
|
894
|
I am trying to call the ItemBar(exBarStart) after curent ending point, and the bar is not updated. What I am doing wrong
with thisform.G2antt1
	.BeginUpdate
	.Columns.Add("Tasks")
	with .Chart
		.PaneWidth(0) = 64
		.FirstVisibleDate = {^2005-6-21}
		.ShowEmptyBars = 1
	endwith
	with .Items
		h = .AddItem("Test")
		.AddBar(h,"Task",{^2005-6-22},{^2005-6-26},"")
		.AddBar(h,"Task",{^2005-6-27},.ItemBar(h,"",2))
	endwith
	.EndUpdate
endwith
|
|
893
|
How can change in the same time the starting and ending points of the bar
with thisform.G2antt1
	.BeginUpdate
	.Columns.Add("Tasks")
	with .Chart
		.PaneWidth(0) = 64
		.FirstVisibleDate = {^2005-6-21}
		.ShowEmptyBars = 1
	endwith
	with .Items
		h = .AddItem("Test")
		.AddBar(h,"Task",{^2005-6-22},{^2005-6-26})
	endwith
	with .Items
		h = .FirstVisibleItem
		.AddBar(h,"Task",{^2005-6-27},{^2005-6-29})
	endwith
	.EndUpdate
endwith
|
|
892
|
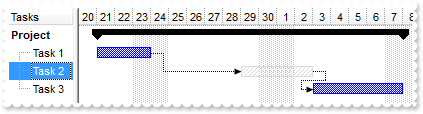
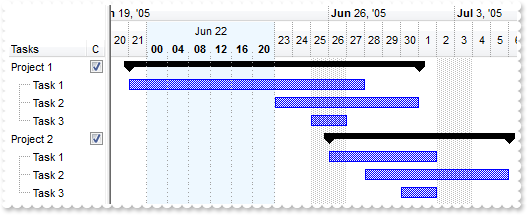
How can I control the exBarEffort property of the bar using slider controls
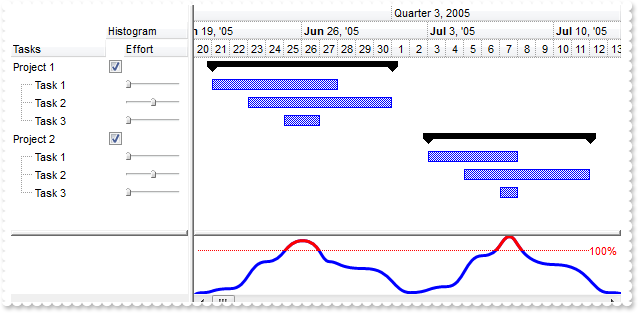
with thisform.G2antt1
	.BeginUpdate
	.MarkSearchColumn = .F.
	.ShowFocusRect = .F.
	.OnResizeControl = 1
	.Columns.Add("Tasks").AllowDragging = .F.
	with .Columns.Add("Histogram")
		.AllowDragging = .F.
		.Def(0) = .T.
		.PartialCheck = .T.
		.AllowSizing = .F.
		.Width = 18
		.LevelKey = 1
	endwith
	.Items.AllowCellValueToItemBar = .T.
	with .Columns.Add("Effort")
		.LevelKey = 1
		.AllowDragging = .F.
		.AllowSizing = .F.
		.Width = 64
		.Def(18) = 21
		with .Editor
			.EditType = 20
			.Option(41) = -100
			.Option(44) = 9
			.Option(43) = 1
		endwith
	endwith
	with .Chart
		.LevelCount = 3
		.NonworkingDays = 0
		.PaneWidth(0) = 160
		.FirstVisibleDate = {^2005-6-20}
		.HistogramVisible = .T.
		.HistogramView = 67348 && 0x10000 Or HistogramViewEnum.exHistogramNoGrouping Or HistogramViewEnum.exHistogramRecLeafItems Or HistogramViewEnum.exHistogramLeafItems Or HistogramViewEnum.exHistogramUnlockedItems Or HistogramViewEnum.exHistogramCheckedItems
		.HistogramHeight = 64
		with .Bars.Item("Task")
			.HistogramCriticalColor = RGB(255,0,0)
			.HistogramPattern = 512
			.HistogramType = 1
		endwith
	endwith
	with .Items
		h = .AddItem("Project 1")
		.AddBar(h,"Summary",{^2005-6-21},{^2005-7-1})
		.CellEditorVisible(h,2) = .F.
		.CellValue(h,2) = ""
		h1 = .InsertItem(h,Null,"Task 1")
		.AddBar(h1,"Task",{^2005-6-21},{^2005-6-28})
		.CellMerge(h1,0) = 1
		.DefineSummaryBars(h,"",h1,"")
		h1 = .InsertItem(h,Null,"Task 2")
		.AddBar(h1,"Task",{^2005-6-23},{^2005-7-1},"")
		.CellMerge(h1,0) = 1
		.DefineSummaryBars(h,"",h1,"")
		.ItemBar(h1,"",21) = 5
		h1 = .InsertItem(h,Null,"Task 3")
		.AddBar(h1,"Task",{^2005-6-25},{^2005-6-27},"")
		.CellMerge(h1,0) = 1
		.DefineSummaryBars(h,"",h1,"")
		.ExpandItem(h) = .T.
		.CellState(h,1) = 1
		h = .AddItem("Project 2")
		.AddBar(h,"Summary",{^2005-3-7},{^2005-7-12})
		.CellEditorVisible(h,2) = .F.
		.CellValue(h,2) = ""
		h1 = .InsertItem(h,Null,"Task 1")
		.AddBar(h1,"Task",{^2005-7-3},{^2005-7-8})
		.CellMerge(h1,0) = 1
		.DefineSummaryBars(h,"",h1,"")
		h1 = .InsertItem(h,Null,"Task 2")
		.AddBar(h1,"Task",{^2005-7-5},{^2005-7-12},"")
		.CellMerge(h1,0) = 1
		.DefineSummaryBars(h,"",h1,"")
		.ItemBar(h1,"",21) = 5
		h1 = .InsertItem(h,Null,"Task 3")
		.AddBar(h1,"Task",{^2005-7-7},{^2005-7-8},"")
		.CellMerge(h1,0) = 1
		.DefineSummaryBars(h,"",h1,"")
		.ExpandItem(h) = .T.
		.CellState(h,1) = 1
	endwith
	.EndUpdate
endwith
|
|
891
|
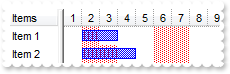
How can I determine if there is any Redo operation
with thisform.G2antt1
	with .Chart
		.AllowUndoRedo = .T.
		.LevelCount = 2
		.FirstVisibleDate = {^2001-1-1}
	endwith
	.Columns.Add("Column")
	with .Items
		.AddBar(.AddItem("Item 1"),"Task",{^2001-1-2},{^2001-1-4})
		.AddBar(.AddItem("Item 2"),"Task",{^2001-1-3},{^2001-1-7})
	endwith
	var_CanRedo = .Chart.CanRedo
endwith
|
|
890
|
How can I determine if there is any Undo operation
with thisform.G2antt1
	with .Chart
		.AllowUndoRedo = .T.
		.LevelCount = 2
		.FirstVisibleDate = {^2001-1-1}
	endwith
	.Columns.Add("Column")
	with .Items
		.AddBar(.AddItem("Item 1"),"Task",{^2001-1-2},{^2001-1-4})
		.AddBar(.AddItem("Item 2"),"Task",{^2001-1-3},{^2001-1-7})
	endwith
	var_CanUndo = .Chart.CanUndo
endwith
|
|
889
|
How can I turn on the Undo/Redo feature
with thisform.G2antt1
	with .Chart
		.AllowUndoRedo = .T.
		.LevelCount = 2
		.FirstVisibleDate = {^2001-1-1}
	endwith
	.Columns.Add("Column")
	with .Items
		.AddBar(.AddItem("Item 1"),"Task",{^2001-1-2},{^2001-1-4})
		.AddBar(.AddItem("Item 2"),"Task",{^2001-1-3},{^2001-1-7})
	endwith
endwith
|
|
888
|
How can I disable resizing the histogram at runtime
with thisform.G2antt1
	.OnResizeControl = 256
	with .Chart
		.FirstVisibleDate = {^2001-1-1}
		.HistogramVisible = .T.
		.HistogramHeight = 32
		.Bars.Item("Task").HistogramPattern = 6
	endwith
	.Columns.Add("Column")
	with .Items
		.AddBar(.AddItem("Item 1"),"Task",{^2001-1-2},{^2001-1-4})
		.AddBar(.AddItem("Item 2"),"Task",{^2001-1-3},{^2001-1-7})
	endwith
endwith
|
|
887
|
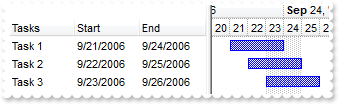
How can I display automatically the start and end dates of the bars in the columns section
with thisform.G2antt1
	.BeginUpdate
	with .Columns
		.Add("Tasks")
		with .Add("Start")
			.Def(18) = 1
			.Editor.EditType = 7
		endwith
		with .Add("End")
			.Def(18) = 2
			.Editor.EditType = 7
		endwith
	endwith
	with .Chart
		.FirstVisibleDate = {^2006-9-20}
		.AllowLinkBars = .T.
		.AllowCreateBar = 0
		.LevelCount = 2
		.PaneWidth(0) = 196
	endwith
	with .Items
		.AllowCellValueToItemBar = .T.
		.AddBar(.AddItem("Task 1"),"Task",{^2006-9-21},{^2006-9-24})
		.AddBar(.AddItem("Task 2"),"Task",{^2006-9-22},{^2006-9-25})
		.AddBar(.AddItem("Task 3"),"Task",{^2006-9-23},{^2006-9-26})
	endwith
	.EndUpdate
endwith
|
|
886
|
How can I enable Undo/Redo support
with thisform.G2antt1
	.BeginUpdate
	.MarkSearchColumn = .F.
	.DrawGridLines = 1
	with .Columns
		.Add("Tasks")
		with .Add("Start")
			.Def(18) = 1
			.Editor.EditType = 7
			.LevelKey = 1
		endwith
		with .Add("End")
			.Def(18) = 2
			.Editor.EditType = 7
			.LevelKey = 1
		endwith
	endwith
	with .Chart
		.DrawGridLines = 1
		.FirstVisibleDate = {^2006-9-20}
		.AllowLinkBars = .T.
		.AllowCreateBar = 0
		.LevelCount = 2
		.PaneWidth(0) = 196
		.AllowUndoRedo = .T.
	endwith
	with .Items
		.AllowCellValueToItemBar = .T.
		.AddBar(.AddItem("Task 1"),"Task",{^2006-9-21},{^2006-9-24})
		.AddBar(.AddItem("Task 2"),"Task",{^2006-9-22},{^2006-9-25})
		.AddBar(.AddItem("Task 3"),"Task",{^2006-9-23},{^2006-9-26})
	endwith
	.EndUpdate
endwith
|
|
885
|
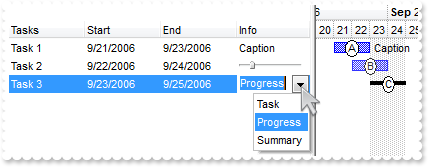
Is there any option to update the bar's properties once the cell's value is changed ( associate the cell with bar )
with thisform.G2antt1
	.BeginUpdate
	.Debug = .T.
	.MarkSearchColumn = .F.
	.Items.AllowCellValueToItemBar = .T.
	with .Columns
		.Add("Tasks")
		.Add("Start").Editor.EditType = 7
		.Add("End").Editor.EditType = 7
		.Add("Info")
	endwith
	with .Chart
		.FirstVisibleDate = {^2006-9-20}
		.AllowLinkBars = .F.
		.AllowCreateBar = 0
		.LevelCount = 2
		.PaneWidth(0) = 224
	endwith
	with .Items
		h1 = .InsertItem(Null,Null,"Task 1")
		.AddBar(h1,"Task",{^2006-9-21},{^2006-9-23},"A","Caption")
		.ItemBar(h1,"A",4) = 18
		.CellEditor(h1,3).EditType = 1
		.CellValueToItemBar(h1,1,1,"A")
		.CellValueToItemBar(h1,2,2,"A")
		.CellValueToItemBar(h1,3,3,"A")
		h2 = .InsertItem(Null,Null,"Task 2")
		.AddBar(h2,"Task",{^2006-9-22},{^2006-9-24},"B")
		with .CellEditor(h2,3)
			.EditType = 20
			.Option(41) = -100
		endwith
		.CellValueToItemBar(h2,1,1,"B")
		.CellValueToItemBar(h2,2,2,"B")
		.CellValueToItemBar(h2,3,19,"B")
		h3 = .InsertItem(Null,Null,"Task 3")
		.AddBar(h3,"Task",{^2006-9-23},{^2006-9-25},"C")
		with .CellEditor(h3,3)
			.EditType = 2
			.AddItem(0,"Task")
			.AddItem(1,"Progress")
			.AddItem(2,"Project Summary")
			.AddItem(2,"Summary")
		endwith
		.CellValueToItemBar(h3,1,1,"C")
		.CellValueToItemBar(h3,2,2,"C")
		.CellValueToItemBar(h3,3,0,"C")
	endwith
	.EndUpdate
endwith
|
|
884
|
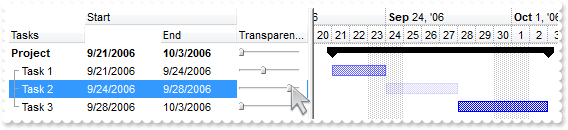
Is there any option to update the bar's properties once the cell's value is changed ( associate the column/cell with bars )
with thisform.G2antt1
	.BeginUpdate
	.MarkSearchColumn = .F.
	.Indent = 11
	.HasLines = 1
	.Items.AllowCellValueToItemBar = .T.
	with .Columns
		.Add("Tasks")
		with .Add("Start")
			.Def(18) = 1
			.Editor.EditType = 7
			.LevelKey = 1
		endwith
		with .Add("End")
			.Def(18) = 2
			.Editor.EditType = 7
			.LevelKey = 1
		endwith
		with .Add("Transparency")
			.Def(18) = 19
			with .Editor
				.EditType = 20
				.Option(41) = -100
			endwith
		endwith
	endwith
	with .Chart
		.FirstVisibleDate = {^2006-9-20}
		.AllowLinkBars = .F.
		.AllowCreateBar = 0
		.LevelCount = 2
		.PaneWidth(0) = 224
	endwith
	with .Items
		h = .AddItem("Project")
		.AddBar(h,"Summary",{^2006-9-21},{^2006-10-3})
		.CellEditorVisible(h,1) = .F.
		.CellEditorVisible(h,2) = .F.
		h1 = .InsertItem(h,Null,"Task 1")
		.AddBar(h1,"Task",{^2006-9-21},{^2006-9-24})
		h2 = .InsertItem(h,Null,"Task 2")
		.AddBar(h2,"Task",{^2006-9-24},{^2006-9-28})
		h3 = .InsertItem(h,Null,"Task 3")
		.AddBar(h3,"Task",{^2006-9-28},{^2006-10-3})
		.DefineSummaryBars(h,"",h1,"")
		.DefineSummaryBars(h,"",h2,"")
		.DefineSummaryBars(h,"",h3,"")
		.ExpandItem(h) = .T.
		.ItemBold(h) = .T.
	endwith
	.EndUpdate
endwith
|
|
883
|
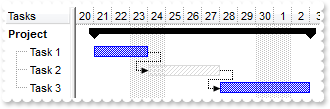
How can I group two bars so I can specify the range or the limit of the interval between them
with thisform.G2antt1
	.BeginUpdate
	.MarkSearchColumn = .F.
	.OnResizeControl = 1
	.Columns.Add("Tasks")
	.Columns.Add("Start").Visible = .F.
	.Columns.Add("End").Visible = .F.
	with .Chart
		.FirstVisibleDate = {^2006-9-20}
		.PaneWidth(0) = 64
	endwith
	with .Items
		h = .AddItem("Project")
		.CellValue(h,1) = {^2006-9-21}
		.CellValue(h,2) = {^2006-10-3}
		.AddBar(h,"Summary",.CellValue(h,1),.CellValue(h,2),"sum")
		h1 = .InsertItem(h,Null,"Task 1")
		.CellValue(h1,1) = .CellValue(h,1)
		.CellValue(h1,2) = {^2006-9-24}
		.AddBar(h1,"Task",.CellValue(h1,1),.CellValue(h1,2),"K1")
		h2 = .InsertItem(h,Null,"Task 2")
		.CellValue(h2,1) = .CellValue(h1,2)
		.CellValue(h2,2) = {^2006-9-28}
		.AddBar(h2,"Unknown",.CellValue(h2,1),.CellValue(h2,2),"K2")
		.AddLink("L1",h1,"K1",h2,"K2")
		h3 = .InsertItem(h,Null,"Task 3")
		.CellValue(h3,1) = .CellValue(h2,2)
		.CellValue(h3,2) = .CellValue(h,2)
		.AddBar(h3,"Task",.CellValue(h3,1),.CellValue(h3,2),"K3")
		.AddLink("L2",h2,"K2",h3,"K3")
		.GroupBars(h1,"K1",.F.,h2,"K2",.T.,31,"0;4")
		.GroupBars(h2,"K2",.F.,h3,"K3",.T.,31,"0;2")
		.DefineSummaryBars(h,"sum",h1,"K1")
		.DefineSummaryBars(h,"sum",h2,"K2")
		.DefineSummaryBars(h,"sum",h3,"K3")
		.ExpandItem(h) = .T.
		.ItemBold(h) = .T.
	endwith
	.EndUpdate
endwith
|
|
882
|
How can I group my bars so I can resize the interval between them but still keep the lengths of them
with thisform.G2antt1
	.BeginUpdate
	.MarkSearchColumn = .F.
	.OnResizeControl = 1
	.Columns.Add("Tasks")
	.Columns.Add("Start").Visible = .F.
	.Columns.Add("End").Visible = .F.
	with .Chart
		.FirstVisibleDate = {^2006-9-20}
		.PaneWidth(0) = 64
	endwith
	with .Items
		h = .AddItem("Project")
		.CellValue(h,1) = {^2006-9-21}
		.CellValue(h,2) = {^2006-10-3}
		.AddBar(h,"Summary",.CellValue(h,1),.CellValue(h,2))
		h1 = .InsertItem(h,Null,"Task 1")
		.CellValue(h1,1) = .CellValue(h,1)
		.CellValue(h1,2) = {^2006-9-24}
		.AddBar(h1,"Task",.CellValue(h1,1),.CellValue(h1,2))
		h2 = .InsertItem(h,Null,"Task 2")
		.CellValue(h2,1) = .CellValue(h1,2)
		.CellValue(h2,2) = {^2006-9-28}
		.AddBar(h2,"Unknown",.CellValue(h2,1),.CellValue(h2,2))
		.AddLink("L1",h1,"",h2,"")
		h3 = .InsertItem(h,Null,"Task 3")
		.CellValue(h3,1) = .CellValue(h2,2)
		.CellValue(h3,2) = .CellValue(h,2)
		.AddBar(h3,"Task",.CellValue(h3,1),.CellValue(h3,2))
		.AddLink("L2",h2,"",h3,"")
		.GroupBars(h1,"",.F.,h2,"",.T.,35)
		.GroupBars(h2,"",.F.,h3,"",.T.,35)
		.DefineSummaryBars(h,"",h1,"")
		.DefineSummaryBars(h,"",h2,"")
		.DefineSummaryBars(h,"",h3,"")
		.ExpandItem(h) = .T.
		.ItemBold(h) = .T.
	endwith
	.EndUpdate
endwith
|
|
881
|
Can I group my bars so they move together when a bar inside changes, but still preserving the length of the bars
with thisform.G2antt1
	.BeginUpdate
	.MarkSearchColumn = .F.
	.OnResizeControl = 1
	.Columns.Add("Tasks")
	.Columns.Add("Start").Visible = .F.
	.Columns.Add("End").Visible = .F.
	with .Chart
		.FirstVisibleDate = {^2006-9-20}
		.PaneWidth(0) = 64
	endwith
	with .Items
		h = .AddItem("Project")
		.CellValue(h,1) = {^2006-9-21}
		.CellValue(h,2) = {^2006-10-3}
		.AddBar(h,"Summary",.CellValue(h,1),.CellValue(h,2))
		h1 = .InsertItem(h,Null,"Task 1")
		.CellValue(h1,1) = .CellValue(h,1)
		.CellValue(h1,2) = {^2006-9-24}
		.AddBar(h1,"Task",.CellValue(h1,1),.CellValue(h1,2))
		h2 = .InsertItem(h,Null,"Task 2")
		.CellValue(h2,1) = .CellValue(h1,2)
		.CellValue(h2,2) = {^2006-9-28}
		.AddBar(h2,"Unknown",.CellValue(h2,1),.CellValue(h2,2))
		.AddLink("L1",h1,"",h2,"")
		h3 = .InsertItem(h,Null,"Task 3")
		.CellValue(h3,1) = .CellValue(h2,2)
		.CellValue(h3,2) = .CellValue(h,2)
		.AddBar(h3,"Task",.CellValue(h3,1),.CellValue(h3,2))
		.AddLink("L2",h2,"",h3,"")
		.GroupBars(h1,"",.F.,h2,"",.T.,3)
		.GroupBars(h2,"",.F.,h3,"",.T.,3)
		.DefineSummaryBars(h,"",h1,"")
		.DefineSummaryBars(h,"",h2,"")
		.DefineSummaryBars(h,"",h3,"")
		.ExpandItem(h) = .T.
		.ItemBold(h) = .T.
	endwith
	.EndUpdate
endwith
|
|
880
|
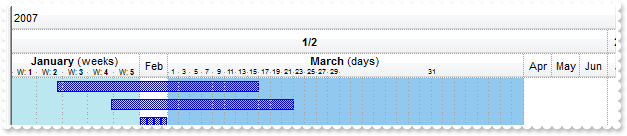
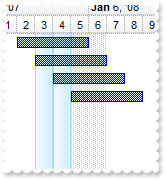
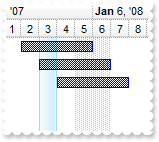
How can I split the time scale, so a section displays days, while other displays weeks, and the other months
with thisform.G2antt1
	.BeginUpdate
	.HeaderHeight = 24
	.Columns.Add("Default")
	with .Chart
		.DrawDateTicker = .T.
		.DrawGridLines = 2
		.NonworkingDays = 0
		.PaneWidth(0) = 0
		.FirstVisibleDate = {^2007-1-1}
		.LevelCount = 3
		with .Level(0)
			.Label = "<%yyyy%>"
			.Unit = 0
		endwith
		with .Level(1)
			.Alignment = 1
			.Label = "<%hy%>"
			.Unit = 1
			.ReplaceLabel("1") = "<b>1/2</b>"
			.ReplaceLabel("2") = "<b>2/2</b>"
		endwith
		with .Level(2)
			.Label = "<%mmm%>"
			.Unit = 16
		endwith
		.UnitWidth = 28
		.AllowInsideZoom = .T.
		with .DefaultInsideZoomFormat
			.OwnerLabel = "<b><%mmmm%></b> (weeks) "
			.InsideLabel = "<font ;6>W: <b><%ww%></b>"
			.InsideUnit = 256
		endwith
		with .InsideZooms
			.SplitBaseLevel = .F.
			with .Add({^2007-1-1})
				.AllowCustomFormat = .T.
				with .CustomFormat
					.OwnerLabel = "<b><%mmmm%></b> (weeks) "
					.InsideLabel = "<font ;6>W: <b><%ww%></b>"
					.InsideUnit = 256
					.BackColorChart = RGB(187,231,240)
				endwith
			endwith
			with .Add({^2007-3-1})
				.AllowCustomFormat = .T.
				.Width = 356
				with .CustomFormat
					.OwnerLabel = "<b><%mmmm%></b> (days) "
					.InsideLabel = "<font ;5><%d%></font>"
					.InsideUnit = 4096
					.BackColorChart = RGB(145,200,240)
				endwith
			endwith
		endwith
	endwith
	with .Items
		h = .AddItem("Task 1 ")
		.AddBar(h,"Task",{^2007-1-12},{^2007-3-9})
		h = .AddItem("Task 2")
		.AddBar(h,"Task",{^2007-1-25},{^2007-3-12})
		h = .AddItem("Task 3")
		.AddBar(h,"Task",{^2007-2-1},{^2007-2-8},"B1")
		.AddBar(h,"Task",{^2007-2-8},{^2007-2-15},"B2")
		.AddBar(h,"Task",{^2007-2-15},{^2007-2-22},"B3")
		.AddBar(h,"Task",{^2007-2-22},{^2007-2-28},"B4")
	endwith
	.EndUpdate
endwith
|
|
879
|
How can I define a bar that shows two colors, one up and one down, without using skin or EBN files
with thisform.G2antt1
	.BeginUpdate
	.Columns.Add("Task")
	.Chart.FirstVisibleDate = {^2001-1-1}
	with .Chart.Bars.Add("A")
		.Color = RGB(255,0,0)
		.Shape = 2
		.Pattern = 1
	endwith
	with .Chart.Bars.Add("B")
		.Color = RGB(128,0,0)
		.Shape = 4
		.Pattern = 1
	endwith
	.Chart.Bars.Add("A%B").Shortcut = "AB"
	with .Items
		h = .AddItem("Task 1")
		.AddBar(h,"AB",{^2001-1-2},{^2001-1-6},"K1")
		.ItemBar(h,"K1",12) = 1
		.ItemBar(h,"K1",16) = .F.
	endwith
	.EndUpdate
endwith
|
|
878
|
Does your control support RightToLeft property for RTL languages or right to left
with thisform.G2antt1
	.BeginUpdate
	.ScrollBars = 15
	.LinesAtRoot = -1
	with .Columns.Add("P1")
		.Def(0) = .T.
		.PartialCheck = .T.
	endwith
	with .Items
		h = .AddItem("Root")
		.InsertItem(h,Null,"Child 1")
		.InsertItem(h,Null,"Child 2")
		.ExpandItem(h) = .T.
	endwith
	.RightToLeft = .T.
	.EndUpdate
endwith
|
|
877
|
Is there any way to display the vertical scroll bar on the left side, as I want to align my data to the right
with thisform.G2antt1
	.BeginUpdate
	.ScrollBars = 15
	with .Columns
		.Add("C1")
		.Add("C2")
		.Add("C3")
		.Add("C4")
		.Add("C5")
		.Add("C6")
		.Add("C7")
		.Add("C8")
	endwith
	.RightToLeft = .T.
	.EndUpdate
endwith
|
|
876
|
Can I display the cell's check box after the text
with thisform.G2antt1
	with .Columns.Add("Column")
		.Def(0) = .T.
		.Def(34) = "caption,check"
	endwith
	with .Items
		.CellHasCheckBox(.AddItem("Caption 1"),0) = .T.
		.CellHasCheckBox(.AddItem("Caption 2"),0) = .T.
	endwith
endwith
|
|
875
|
Can I change the order of the parts in the cell, as checkbox after the text, and so on
with thisform.G2antt1
	var_s = "gBJJgBAIDAAGAAEAAQhYAf8Pf4hh0QihCJo2AEZjQAjEZFEaIEaEEaAIAkcbk0olUrlktl0vmExmUzmk1m03nE5nU7nk9n0/oFBoVDolFo1HpFJpVLplNp1PqFRqVTql"
	var_s = var_s + "Vq1XrFZrVbrldr1fsFhsVjslls1ntFptVrtltt1vuFxuVzul1u13vF5vV7vl9v1/wGBwWDwmFw2HxGJxWLxmNx0xiFdyOTh8Tf9ZymXx+QytcyNgz8r0OblWjyWds+m0"
	var_s = var_s + "ka1Vf1ta1+r1mos2xrG2xeZ0+a0W0qOx3GO4NV3WeyvD2XJ5XL5nN51aiw+lfSj0gkUkAEllHanHI5j/cHg8EZf7w8vl8j4f/qfEZeB09/vjLAB30+kZQAP/P5/H6/yN"
	var_s = var_s + "AOAEAwCjMBwFAEDwJBMDwLBYAP2/8Hv8/gAGAD8LQs9w/nhDY/oygIA="
	.Images(var_s)
	.Columns.Add("Column").Def(34) = "caption,check,icon,icons,picture"
	with .Items
		h = .AddItem("Text")
		.CellImage(h,0) = 1
		.CellHasCheckBox(h,0) = .T.
	endwith
endwith
|
|
874
|
Can I have an image displayed after the text. Can I get that effect without using HTML content
with thisform.G2antt1
	var_s = "gBJJgBAIDAAGAAEAAQhYAf8Pf4hh0QihCJo2AEZjQAjEZFEaIEaEEaAIAkcbk0olUrlktl0vmExmUzmk1m03nE5nU7nk9n0/oFBoVDolFo1HpFJpVLplNp1PqFRqVTql"
	var_s = var_s + "Vq1XrFZrVbrldr1fsFhsVjslls1ntFptVrtltt1vuFxuVzul1u13vF5vV7vl9v1/wGBwWDwmFw2HxGJxWLxmNx0xiFdyOTh8Tf9ZymXx+QytcyNgz8r0OblWjyWds+m0"
	var_s = var_s + "ka1Vf1ta1+r1mos2xrG2xeZ0+a0W0qOx3GO4NV3WeyvD2XJ5XL5nN51aiw+lfSj0gkUkAEllHanHI5j/cHg8EZf7w8vl8j4f/qfEZeB09/vjLAB30+kZQAP/P5/H6/yN"
	var_s = var_s + "AOAEAwCjMBwFAEDwJBMDwLBYAP2/8Hv8/gAGAD8LQs9w/nhDY/oygIA="
	.Images(var_s)
	.Columns.Add("Column").Def(34) = "caption,icon,check,icons,picture"
	with .Items
		h = .AddItem("Text")
		.CellImage(h,0) = 1
	endwith
endwith
|
|
873
|
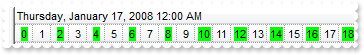
My problem is that I want to mark the cells from every second item in the gant with a other backgroundcolor
with thisform.G2antt1
	with .Chart
		.PaneWidth(0) = 0
		.FirstVisibleDate = {^2008-1-17}
		.LevelCount = 2
		.UnitScale = 16777216
		.Level(1).FormatLabel = "(0:=sec(dvalue)) mod 2 ? 0=: : '<bgcolor=00FF00>' + 0=:"
	endwith
endwith
|
|
872
|
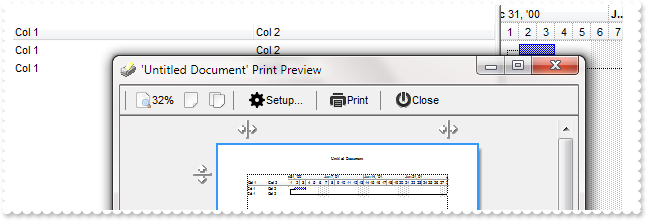
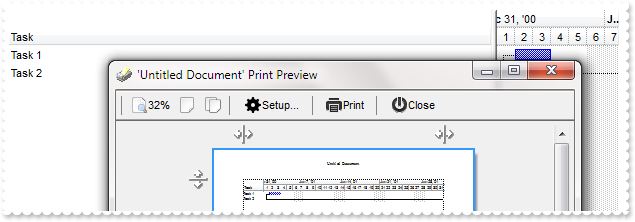
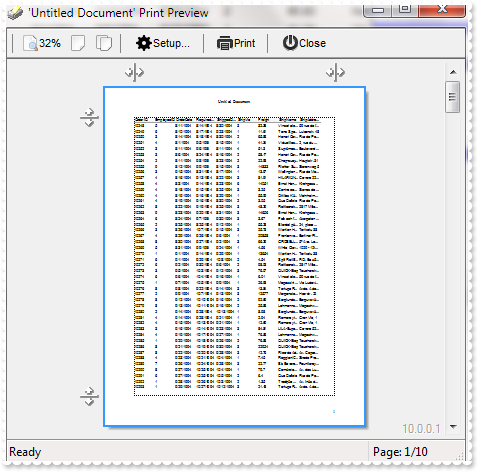
Is there any option to print the columns section on each page
with thisform.G2antt1
	.BeginUpdate
	.Columns.Add("Col 1")
	.Columns.Add("Col 2")
	.MarkSearchColumn = .F.
	.Chart.FirstVisibleDate = {^2001-1-1}
	.Chart.LevelCount = 2
	with .Items
		h1 = .AddItem("Col 1")
		.CellValue(h1,1) = "Col 2"
		.AddBar(h1,"Task",{^2001-1-2},{^2001-1-4},"K1")
		h2 = .AddItem("Col 1")
		.CellValue(h2,1) = "Col 2"
		.AddBar(h2,"Task",{^2001-2-5},{^2001-2-7},"K2")
		.AddLink("L1",h1,"K1",h2,"K2")
		.Link("L1",6) = 0
	endwith
	.EndUpdate
	with CreateObject("Exontrol.Print")
		.Options = "ColumnsOnEveryPage=-2"
		.PrintExt = thisform.G2antt1.Object
		.Preview
	endwith
endwith
|
|
871
|
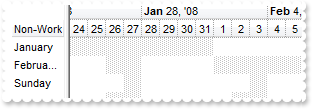
How can I add a different non-working area for different items
with thisform.G2antt1
	.BeginUpdate
	.Columns.Add("Non-Work")
	with .Chart
		.FirstWeekDay = 1
		.FirstVisibleDate = {^2008-1-24}
		.PaneWidth(0) = 52
		.LevelCount = 2
	endwith
	with .Items
		h = .AddItem("January")
		.ItemNonworkingUnits(h,.F.) = "month(value) = 1"
		h = .AddItem("February, Saturday, Sunday")
		.ItemNonworkingUnits(h,.F.) = "month(value) = 2 or (weekday(value) = 0 or weekday(value) = 6)"
		h = .AddItem("Sunday")
		.ItemNonworkingUnits(h,.F.) = "weekday(value) = 0"
	endwith
	.EndUpdate
endwith
|
|
870
|
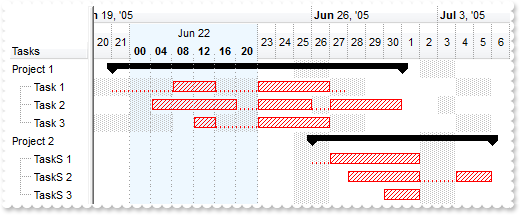
How can I define different non-working units for different items
with thisform.G2antt1
	.BeginUpdate
	.Columns.Add("Tasks")
	with .Chart
		.PaneWidth(0) = 78
		.AllowCreateBar = 1
		.FirstVisibleDate = {^2005-6-20}
		.DrawLevelSeparator = .F.
		.LevelCount = 3
		.Level(1).DrawGridLines = .F.
		.AllowInsideZoom = .T.
		.DrawDateTicker = .T.
		.DateTickerLabel = "<%mmm%> <%d%><br><b><%hh%>:<%nn%></b>"
		.MarkSelectDateColor = 0x7ffff8ee
		with .DefaultInsideZoomFormat
			.OwnerLabel = "<%mmm%> <%d%>"
			.BackColor = RGB(238,248,255)
			.BackColorChart = .BackColor
			.InsideCount = 4
			.InsideLabel = "<b><%hh%></b>"
		endwith
		.InsideZooms.Add({^2005-6-22})
		.DrawGridLines = 2
		.Bars.Item("Split").Color = RGB(255,0,0)
		with .Bars.Add("Task:Split")
			.Color = RGB(255,0,0)
			.Pattern = 6
			.Shortcut = "TaskS"
		endwith
	endwith
	with .Items
		h = .AddItem("Project 1")
		.AddBar(h,"Summary",{^2005-6-21},{^2005-7-1})
		h1 = .InsertItem(h,Null,"Task 1")
		.AddBar(h1,"TaskS",{^2005-6-21},{^2005-6-28})
		.ItemNonworkingUnits(h1,.F.) = "weekday(value)=1 or weekday(value)=2"
		.ItemNonworkingUnits(h1,.T.) = "weekday(value)=1 or weekday(value)=2 or (hour(value)<8 or hour(value)>=16 )"
		.DefineSummaryBars(h,"",h1,"")
		h1 = .InsertItem(h,Null,"Task 2")
		.AddBar(h1,"TaskS",{^2005-6-22 4:00:00},{^2005-7-1},"E")
		.ItemNonworkingUnits(h1,.F.) = "weekday(value)=0"
		.ItemNonworkingUnits(h1,.T.) = "weekday(value)=0 or hour(value)<4 or hour(value)>19"
		.DefineSummaryBars(h,"",h1,"E")
		.ItemBar(h1,"E",21) = 5
		h1 = .InsertItem(h,Null,"Task 3")
		.AddBar(h1,"TaskS",{^2005-6-22 12:00:00},{^2005-6-27},"E")
		.ItemNonworkingUnits(h1,.F.) = "weekday(value)=1 or weekday(value)=2"
		.ItemNonworkingUnits(h1,.T.) = "weekday(value)=1 or weekday(value)=2 or (hour(value)<8 or hour(value)>=16 )"
		.DefineSummaryBars(h,"",h1,"E")
		.ExpandItem(h) = .T.
		h = .AddItem("Project 2")
		.AddBar(h,"Summary",{^2005-6-26},{^2005-7-6})
		h1 = .InsertItem(h,Null,"TaskS 1")
		.AddBar(h1,"TaskS",{^2005-6-26},{^2005-7-2})
		.DefineSummaryBars(h,"",h1,"")
		h1 = .InsertItem(h,Null,"TaskS 2")
		.AddBar(h1,"TaskS",{^2005-6-28},{^2005-7-6},"E")
		.DefineSummaryBars(h,"",h1,"E")
		.ItemBar(h1,"E",21) = 5
		h1 = .InsertItem(h,Null,"TaskS 3")
		.AddBar(h1,"TaskS",{^2005-6-30},{^2005-7-2},"E")
		.DefineSummaryBars(h,"",h1,"E")
		.ExpandItem(h) = .T.
	endwith
	.EndUpdate
endwith
|
|
869
|
I want to define/highlight for specified dates as being non-working. Is this possible
with thisform.G2antt1
	.BeginUpdate
	.Columns.Add("Items")
	with .Chart
		.NonworkingDaysColor = RGB(255,0,0)
		.PaneWidth(0) = 48
		c = .NonworkingDaysColor
		p = .NonworkingDaysPattern && .NonworkingDaysPattern
		.FirstVisibleDate = {^2001-1-1}
		with .Bars.Add("NW")
			.Color = c
			.Pattern = p && p
			.Height = -1
			.Shape = 17
		endwith
	endwith
	with .Items
		h = .AddItem("Item 1")
		.AddBar(h,"NW",{^2001-1-2},{^2001-1-3},"0")
		.ItemBar(h,"0",29) = .F.
		.AddBar(h,"Task",{^2001-1-2},{^2001-1-4},"K2")
		h = .AddItem("Item 2")
		.AddBar(h,"NW",{^2001-1-2},{^2001-1-4},"0")
		.ItemBar(h,"0",29) = .F.
		.AddBar(h,"Task",{^2001-1-2},{^2001-1-5},"K2")
	endwith
	.EndUpdate
endwith
|
|
868
|
Do you have any sample how can I programmatically magnify a single date, so can show the hours, while the rest of the chart displays days
with thisform.G2antt1
	.BeginUpdate
	.MarkSearchColumn = .F.
	.ShowFocusRect = .F.
	.Columns.Add("Tasks")
	with .Columns.Add("C")
		.HeaderAlignment = 1
		.Def(0) = .T.
		.PartialCheck = .T.
		.AllowSizing = .F.
		.Width = 18
	endwith
	with .Chart
		.PaneWidth(0) = 96
		.AllowCreateBar = 1
		.FirstVisibleDate = {^2005-6-20}
		.DrawLevelSeparator = .F.
		.LevelCount = 3
		.Level(1).DrawGridLines = .F.
		.AllowInsideZoom = .T.
		.DrawDateTicker = .T.
		.DateTickerLabel = "<%mmm%> <%d%><br><b><%hh%>:<%nn%></b>"
		.MarkSelectDateColor = 0x7ffff8ee
		with .DefaultInsideZoomFormat
			.OwnerLabel = "<%mmm%> <%d%>"
			.BackColor = RGB(238,248,255)
			.BackColorChart = .BackColor
			.InsideCount = 4
			.InsideLabel = "<b><%hh%></b>"
		endwith
		.InsideZooms.Add({^2005-6-22})
		.DrawGridLines = 2
	endwith
	with .Items
		h = .AddItem("Project 1")
		.AddBar(h,"Summary",{^2005-6-21},{^2005-7-1})
		h1 = .InsertItem(h,Null,"Task 1")
		.AddBar(h1,"Task",{^2005-6-21},{^2005-6-28})
		.CellMerge(h1,0) = 1
		.DefineSummaryBars(h,"",h1,"")
		h1 = .InsertItem(h,Null,"Task 2")
		.AddBar(h1,"Task",{^2005-6-23},{^2005-7-1},"E")
		.CellMerge(h1,0) = 1
		.DefineSummaryBars(h,"",h1,"E")
		.ItemBar(h1,"E",21) = 5
		h1 = .InsertItem(h,Null,"Task 3")
		.AddBar(h1,"Task",{^2005-6-25},{^2005-6-27},"E")
		.CellMerge(h1,0) = 1
		.DefineSummaryBars(h,"",h1,"E")
		.ExpandItem(h) = .T.
		.CellState(h,1) = 1
		h = .AddItem("Project 2")
		.AddBar(h,"Summary",{^2005-6-26},{^2005-7-6})
		h1 = .InsertItem(h,Null,"Task 1")
		.AddBar(h1,"Task",{^2005-6-26},{^2005-7-2})
		.CellMerge(h1,0) = 1
		.DefineSummaryBars(h,"",h1,"")
		h1 = .InsertItem(h,Null,"Task 2")
		.AddBar(h1,"Task",{^2005-6-28},{^2005-7-6},"E")
		.CellMerge(h1,0) = 1
		.DefineSummaryBars(h,"",h1,"E")
		.ItemBar(h1,"E",21) = 5
		h1 = .InsertItem(h,Null,"Task 3")
		.AddBar(h1,"Task",{^2005-6-30},{^2005-7-2},"E")
		.CellMerge(h1,0) = 1
		.DefineSummaryBars(h,"",h1,"E")
		.ExpandItem(h) = .T.
		.CellState(h,1) = 1
	endwith
	.EndUpdate
endwith
|
|
867
|
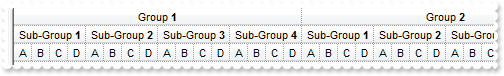
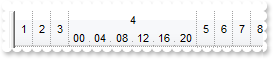
How can I define my own/custom labels and subdivisions
with thisform.G2antt1
	.BeginUpdate
	with .Chart
		.ToolTip = ""
		.PaneWidth(0) = 0
		.ScrollRange(0) = 0
		.ScrollRange(1) = 110
		.FirstVisibleDate = 0
		.ShowNonworkingDates = .F.
		.MarkTodayColor = .BackColor
		.LevelCount = 3
		with .Level(0)
			.ToolTip = ""
			.Alignment = 1
			.Unit = 4096
			.Count = 16
			.FormatLabel = "'Group <b>'+int(1 +dvalue/16)"
		endwith
		with .Level(1)
			.ToolTip = ""
			.Alignment = 1
			.Unit = 4096
			.Count = 4
			.FormatLabel = " (abs(dvalue)/4) mod 4"
			.ReplaceLabel("0") = "Sub-Group <b>1</b>"
			.ReplaceLabel("1") = "Sub-Group <b>2</b>"
			.ReplaceLabel("2") = "Sub-Group <b>3</b>"
			.ReplaceLabel("3") = "Sub-Group <b>4</b>"
		endwith
		with .Level(2)
			.ToolTip = ""
			.Unit = 4096
			.Count = 1
			.FormatLabel = "(abs(dvalue) mod 4)"
			.ReplaceLabel("0") = "A"
			.ReplaceLabel("1") = "B"
			.ReplaceLabel("2") = "C"
			.ReplaceLabel("3") = "D"
		endwith
	endwith
	.EndUpdate
endwith
|
|
866
|
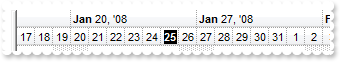
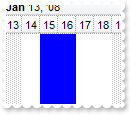
I want to mark or highlight the last Friday of the month. Is there any option to do that
with thisform.G2antt1
	with .Chart
		.PaneWidth(0) = 0
		.FirstVisibleDate = {^2008-1-17}
		.LevelCount = 2
		.Level(1).FormatLabel = "(weekday(dvalue)=5 ? month(dvalue+7)!=month(dvalue) ? '<b><bgcolor=000000><fgcolor=FFFFFF>' ) + value"
	endwith
endwith
|
|
865
|
I use the SelectDate method but the dates are not being highligted. What can I do
with thisform.G2antt1
	.BeginUpdate
	with .Chart
		.FirstVisibleDate = {^2008-1-1}
		.MarkTodayColor = .BackColor
		.LevelCount = 2
		.SelectLevel = 1
		.SelectDate({^2008-1-2}) = .T.
	endwith
	.EndUpdate
endwith
|
|
864
|
Can I use ebn files to display the selected dates
with thisform.G2antt1
	.BeginUpdate
	with .VisualAppearance
		.Add(2,"c:\exontrol\images\normal.ebn")
		.Add(1,"CP:2 0 -4 0 4")
	endwith
	with .Chart
		.FirstVisibleDate = {^2008-1-1}
		.MarkTodayColor = .BackColor
		.LevelCount = 2
		.MarkSelectDateColor = 0x1000000
		.SelectLevel = 1
		.SelectDate({^2008-1-3}) = .T.
		.SelectDate({^2008-1-4}) = .T.
	endwith
	.Columns.Add("Default")
	with .Items
		.AddBar(.AddItem("Item 1"),"Task",{^2008-1-2},{^2008-1-6})
		.AddBar(.AddItem("Item 2"),"Task",{^2008-1-3},{^2008-1-7})
		.AddBar(.AddItem("Item 3"),"Task",{^2008-1-4},{^2008-1-8})
		.AddBar(.AddItem("Item 4"),"Task",{^2008-1-5},{^2008-1-9})
	endwith
	.EndUpdate
endwith
|
|
863
|
Can I use ebn files to display the selected dates
with thisform.G2antt1
	.BeginUpdate
	.VisualAppearance.Add(1,"c:\exontrol\images\normal.ebn")
	with .Chart
		.FirstVisibleDate = {^2008-1-1}
		.MarkTodayColor = .BackColor
		.LevelCount = 2
		.MarkSelectDateColor = 0x1000000
		.SelectLevel = 1
		.SelectDate({^2008-1-3}) = .T.
	endwith
	.Columns.Add("Default")
	with .Items
		.AddBar(.AddItem("Item 1"),"Task",{^2008-1-2},{^2008-1-6})
		.AddBar(.AddItem("Item 2"),"Task",{^2008-1-3},{^2008-1-7})
		.AddBar(.AddItem("Item 3"),"Task",{^2008-1-4},{^2008-1-8})
	endwith
	.EndUpdate
endwith
|
|
862
|
How can I change the color for selected dates to be solid
with thisform.G2antt1
	.BeginUpdate
	with .Chart
		.PaneWidth(0) = 0
		.FirstVisibleDate = {^2008-1-1}
		.MarkTodayColor = .BackColor
		.LevelCount = 2
		.MarkSelectDateColor = 0x7fff0000
		.SelectLevel = 1
		.SelectDate({^2008-1-15}) = .T.
		.SelectDate({^2008-1-16}) = .T.
	endwith
	.EndUpdate
endwith
|
|
861
|
How can I disable selecting dates when I click the chart's header
with thisform.G2antt1
	.Chart.AllowSelectDate = .F.
endwith
|
|
860
|
Is there any option to specify which dates can be magnified or resized
with thisform.G2antt1
	.BeginUpdate
	with .Chart
		.LevelCount = 2
		.FirstVisibleDate = {^2008-1-1}
		.AllowInsideZoom = .T.
		.ShowNonworkingDates = .T.
		.CondInsideZoom = "not(weekday(value) = 0 or weekday(value) = 6)"
	endwith
	.EndUpdate
endwith
|
|
859
|
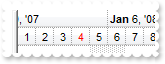
How can I change the width for a specified date time unit
with thisform.G2antt1
	.BeginUpdate
	with .Chart
		.LevelCount = 2
		.FirstVisibleDate = {^2008-1-1}
		.AllowInsideZoom = .T.
		.AllowResizeInsideZoom = .F.
		.InsideZoomOnDblClick = .F.
		with .InsideZooms
			with .Add({^2008-1-4})
				.Width = 32
				.AllowInsideFormat = .F.
			endwith
		endwith
	endwith
	.EndUpdate
endwith
|
|
858
|
How can I disable the control's splitter so the user can't resize the list area
with thisform.G2antt1
	.OnResizeControl = 129 && OnResizeControlEnum.exDisableSplitter Or OnResizeControlEnum.exResizeChart
	.Chart.PaneWidth(0) = 60
endwith
|
|
857
|
How can I disable the control's splitter so the user can't resize the chart area
with thisform.G2antt1
	.OnResizeControl = 128
	.Chart.PaneWidth(1) = 60
endwith
|
|
856
|
How can I change the label for a specified unit
with thisform.G2antt1
	.BeginUpdate
	with .Chart
		.PaneWidth(0) = 0
		.LevelCount = 2
		.FirstVisibleDate = {^2008-1-1}
		.AllowInsideZoom = .T.
		.AllowResizeInsideZoom = .F.
		.InsideZoomOnDblClick = .F.
		.DefaultInsideZoomFormat.OwnerLabel = "<b><%d%></b> <%d2%>"
		with .InsideZooms
			.SplitBaseLevel = .F.
			.DefaultWidth = 32
			.Add({^2008-1-4}).AllowInsideFormat = .F.
		endwith
	endwith
	.EndUpdate
endwith
|
|
855
|
How can I bold the inside units
with thisform.G2antt1
	.BeginUpdate
	with .Chart
		.PaneWidth(0) = 0
		.LevelCount = 2
		.FirstVisibleDate = {^2008-1-1}
		.AllowInsideZoom = .T.
		.AllowResizeInsideZoom = .F.
		.InsideZoomOnDblClick = .F.
		.DefaultInsideZoomFormat.InsideLabel = "<b><%hh%></b>"
		.InsideZooms.Add({^2008-1-4})
	endwith
	.EndUpdate
endwith
|
|
854
|
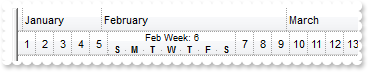
How can I change the scale unit when doing inside zoom ( the chart displays weeks, and we want week days )
with thisform.G2antt1
	.BeginUpdate
	with .Chart
		.ShowNonworkingDates = .F.
		.PaneWidth(0) = 0
		.LevelCount = 2
		with .Level(0)
			.Label = "<%mmmm%>"
			.Unit = 16
		endwith
		with .Level(1)
			.Label = "<%ww%>"
			.Unit = 256
		endwith
		.FirstVisibleDate = {^2008-1-1}
		.AllowInsideZoom = .T.
		with .DefaultInsideZoomFormat
			.OwnerLabel = "<font ;7><%mmm%> Week: <%ww%>"
			.InsideLabel = "<font ;7><b><%d1%></b>"
			.InsideUnit = 4096
		endwith
		with .InsideZooms
			.SplitBaseLevel = .F.
			.Add({^2008-2-3})
		endwith
	endwith
	.EndUpdate
endwith
|
|
853
|
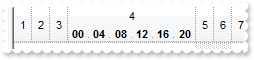
How can I zoom or magnify the selected date to display the hours, from 8 to 8
with thisform.G2antt1
	.BeginUpdate
	with .Chart
		.PaneWidth(0) = 0
		.LevelCount = 2
		.FirstVisibleDate = {^2008-1-1}
		.AllowInsideZoom = .T.
		with .DefaultInsideZoomFormat
			.InsideLabel = "H: <b><%hh%></b>"
			.InsideUnit = 65536
			.InsideCount = 8
		endwith
		with .InsideZooms
			.Add({^2008-1-4})
		endwith
	endwith
	.EndUpdate
endwith
|
|
852
|
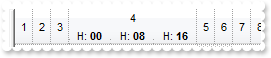
How can I zoom or magnify the selected date to display the hours
with thisform.G2antt1
	.BeginUpdate
	with .Chart
		.PaneWidth(0) = 0
		.LevelCount = 2
		.FirstVisibleDate = {^2008-1-1}
		.AllowInsideZoom = .T.
		with .InsideZooms
			.Add({^2008-1-4})
		endwith
	endwith
	.EndUpdate
endwith
|
|
851
|
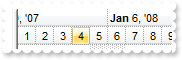
How can I change the foreground color for a time unit
with thisform.G2antt1
	.BeginUpdate
	with .Chart
		.LevelCount = 2
		.FirstVisibleDate = {^2008-1-1}
		.AllowInsideZoom = .T.
		.AllowResizeInsideZoom = .F.
		.InsideZoomOnDblClick = .F.
		.DefaultInsideZoomFormat.ForeColor = RGB(255,0,0)
		with .InsideZooms
			.SplitBaseLevel = .F.
			.DefaultWidth = 18
			.Add({^2008-1-4}).AllowInsideFormat = .F.
		endwith
	endwith
	.EndUpdate
endwith
|
|
850
|
How can I change the background color for a time unit, in the chart area
with thisform.G2antt1
	.BeginUpdate
	with .Chart
		.LevelCount = 2
		.FirstVisibleDate = {^2008-1-1}
		.AllowInsideZoom = .T.
		.AllowResizeInsideZoom = .F.
		.InsideZoomOnDblClick = .F.
		.DefaultInsideZoomFormat.BackColorChart = RGB(255,0,0)
		with .InsideZooms
			.SplitBaseLevel = .F.
			.DefaultWidth = 18
			.Add({^2008-1-4}).AllowInsideFormat = .F.
		endwith
	endwith
	.EndUpdate
endwith
|
|
849
|
How can I change the background color for a time unit, using EBN files
with thisform.G2antt1
	.BeginUpdate
	.VisualAppearance.Add(1,"c:\exontrol\images\normal.ebn")
	with .Chart
		.LevelCount = 2
		.FirstVisibleDate = {^2008-1-1}
		.AllowInsideZoom = .T.
		.AllowResizeInsideZoom = .F.
		.InsideZoomOnDblClick = .F.
		.DefaultInsideZoomFormat.BackColor = 0x1000000
		with .InsideZooms
			.SplitBaseLevel = .F.
			.DefaultWidth = 18
			.Add({^2008-1-4}).AllowInsideFormat = .F.
		endwith
	endwith
	.EndUpdate
endwith
|
|
848
|
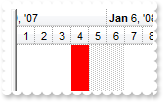
How can I change the background color for a time unit
with thisform.G2antt1
	.BeginUpdate
	with .Chart
		.LevelCount = 2
		.FirstVisibleDate = {^2008-1-1}
		.AllowInsideZoom = .T.
		.AllowResizeInsideZoom = .F.
		.InsideZoomOnDblClick = .F.
		.DefaultInsideZoomFormat.BackColor = RGB(255,0,0)
		with .InsideZooms
			.SplitBaseLevel = .F.
			.DefaultWidth = 18
			.Add({^2008-1-4}).AllowInsideFormat = .F.
		endwith
	endwith
	.EndUpdate
endwith
|
|
847
|
How can I display the column using currency format and enlarge the font for certain values
with thisform.G2antt1
	with .Columns.Add("Currency")
		.Def(17) = 1
		.FormatColumn = "len(value) ? ((0:=dbl(value)) < 10 ? '<fgcolor=808080><font ;7>' : '<b>') + currency(=:0)"
	endwith
	with .Items
		.AddItem("1.23")
		.AddItem("2.34")
		.AddItem("9.94")
		.AddItem("11.94")
		.AddItem("1000")
	endwith
endwith
|
|
846
|
How can I highlight only parts of the cells
with thisform.G2antt1
	with .Columns.Add("")
		.Def(17) = 1
		.FormatColumn = "value replace 'hil' with '<fgcolor=FF0000><b>hil</b></fgcolor>'"
	endwith
	with .Items
		h = .AddItem("Root")
		.InsertItem(h,Null,"Child 1")
		.InsertItem(h,Null,"Child 2")
		.InsertItem(h,Null,"Child 3")
		.ExpandItem(h) = .T.
	endwith
endwith
|
|
845
|
How can I get the number of occurrences of a specified string in the cell
with thisform.G2antt1
	.Columns.Add("")
	with .Columns.Add("occurrences")
		.ComputedField = "lower(%0) count 'o'"
		.FormatColumn = "'contains ' + value + ' of \'o\' chars'"
	endwith
	with .Items
		h = .AddItem("Root")
		.InsertItem(h,Null,"Child 1 oooof the root")
		.InsertItem(h,Null,"Child 2")
		.InsertItem(h,Null,"Child 3")
		.ExpandItem(h) = .T.
	endwith
endwith
|
|
844
|
How can I display dates in my format
with thisform.G2antt1
	with .Columns.Add("Date")
		.Def(17) = 1
		.FormatColumn = "'<b>' + year(0:=date(value)) + '</b><fgcolor=808080><font ;6> (' + month(=:0) + ' - ' + day(=:0) +')'"
	endwith
	with .Items
		.AddItem({^2001-1-21})
		.AddItem({^2002-2-22})
		.AddItem({^2003-3-13})
		.AddItem({^2004-4-24})
	endwith
endwith
|
|
843
|
How can I display dates in short format
with thisform.G2antt1
	.Columns.Add("Date").FormatColumn = "shortdate(value)"
	with .Items
		.AddItem({^2001-1-1})
		.AddItem({^2002-2-2})
		.AddItem({^2003-3-3})
		.AddItem({^2004-4-4})
	endwith
endwith
|
|
842
|
How can I display dates in long format
with thisform.G2antt1
	.Columns.Add("Date").FormatColumn = "longdate(value)"
	with .Items
		.AddItem({^2001-1-1})
		.AddItem({^2002-2-2})
		.AddItem({^2003-3-3})
		.AddItem({^2004-4-4})
	endwith
endwith
|
|
841
|
How can I display only the right part of the cell
with thisform.G2antt1
	.Columns.Add("")
	with .Columns.Add("Right")
		.ComputedField = "%0 right 2"
		.FormatColumn = "'"+chr(34)+"' + value + '"+chr(34)+"'"
	endwith
	with .Items
		h = .AddItem("Root")
		.InsertItem(h,Null,"Child 1")
		.InsertItem(h,Null,"Child 2")
		.InsertItem(h,Null,"SChild 3")
		.ExpandItem(h) = .T.
	endwith
endwith
|
|
840
|
How can I display only the left part of the cell
with thisform.G2antt1
	.Columns.Add("")
	.Columns.Add("Left").ComputedField = "%0 left 2"
	with .Items
		h = .AddItem("Root")
		.InsertItem(h,Null,"Child 1")
		.InsertItem(h,Null,"Child 2")
		.InsertItem(h,Null,"SChild 3")
		.ExpandItem(h) = .T.
	endwith
endwith
|
|
839
|
How can I display true or false instead 0 and -1
with thisform.G2antt1
	.Columns.Add("Boolean").FormatColumn = "value != 0 ? 'true' : 'false'"
	with .Items
		.AddItem(.T.)
		.AddItem(.F.)
		.AddItem(.T.)
		.AddItem(0)
		.AddItem(1)
	endwith
endwith
|
|
838
|
Is there any option to print the columns section on each page
with thisform.G2antt1
	.BeginUpdate
	.Columns.Add("Task")
	.Chart.FirstVisibleDate = {^2001-1-1}
	.Chart.LevelCount = 2
	with .Items
		h1 = .AddItem("Task 1")
		.AddBar(h1,"Task",{^2001-1-2},{^2001-1-4},"K1")
		h2 = .AddItem("Task 2")
		.AddBar(h2,"Task",{^2001-2-5},{^2001-2-7},"K2")
		.AddLink("L1",h1,"K1",h2,"K2")
		.Link("L1",6) = 0
	endwith
	.EndUpdate
	with CreateObject("Exontrol.Print")
		.Options = "ColumnsOnEveryPage=1"
		.PrintExt = thisform.G2antt1.Object
		.Preview
	endwith
endwith
|
|
837
|
How do I print the control's content
with thisform.G2antt1
	.BeginUpdate
	.Columns.Add("Task")
	.Chart.FirstVisibleDate = {^2001-1-1}
	with .Items
		h1 = .AddItem("Task 1")
		.AddBar(h1,"Task",{^2001-1-2},{^2001-1-4},"K1")
		h2 = .AddItem("Task 2")
		.AddBar(h2,"Task",{^2001-1-5},{^2001-1-7},"K2")
		.AddLink("L1",h1,"K1",h2,"K2")
		.Link("L1",6) = 0
	endwith
	.EndUpdate
	with CreateObject("Exontrol.Print")
		.PrintExt = thisform.G2antt1.Object
		.Preview
	endwith
endwith
|
|
836
|
How can I display icons or images instead numbers
with thisform.G2antt1
	var_s = "gBJJgBAIDAAGAAEAAQhYAf8Pf4hh0QihCJo2AEZjQAjEZFEaIEaEEaAIAkcbk0olUrlktl0vmExmUzmk1m03nE5nU7nk9n0/oFBoVDolFo1HpFJpVLplNp1PqFRqVTql"
	var_s = var_s + "Vq1XrFZrVbrldr1fsFhsVjslls1ntFptVrtltt1vuFxuVzul1u13vF5vV7vl9v1/wGBwWDwmFw2HxGJxWLxmNx0xiFdyOTh8Tf9ZymXx+QytcyNgz8r0OblWjyWds+m0"
	var_s = var_s + "ka1Vf1ta1+r1mos2xrG2xeZ0+a0W0qOx3GO4NV3WeyvD2XJ5XL5nN51aiw+lfSj0gkUkAEllHanHI5j/cHg8EZf7w8vl8j4f/qfEZeB09/vjLAB30+kZQAP/P5/H6/yN"
	var_s = var_s + "AOAEAwCjMBwFAEDwJBMDwLBYAP2/8Hv8/gAGAD8LQs9w/nhDY/oygIA="
	.Images(var_s)
	with .Columns.Add("Icons")
		.Def(17) = 1
		.FormatColumn = "'The cell displays the icon <img>'+value+'</img> instead ' + value"
	endwith
	with .Items
		.AddItem(1)
		.AddItem(2)
		.AddItem(3)
	endwith
endwith
|
|
835
|
How can I display the column using currency
with thisform.G2antt1
	.Columns.Add("Currency").FormatColumn = "currency(dbl(value))"
	with .Items
		.AddItem("1.23")
		.AddItem("2.34")
		.AddItem("0")
		.AddItem(5)
		.AddItem("10000.99")
	endwith
endwith
|
|
834
|
How can I display the currency only for not empty cells
with thisform.G2antt1
	.Columns.Add("Number")
	.Columns.Add("Currency").ComputedField = "len(%0) ? currency(dbl(%0)) : ''"
	with .Items
		.AddItem("1.23")
		.AddItem("2.34")
		.AddItem("0")
		.ItemBackColor(.AddItem()) = RGB(255,128,128)
		.AddItem("10000.99")
	endwith
endwith
|
|
833
|
Is there a function to display the number of days between two date including the number of hours
with thisform.G2antt1
	.Columns.Add("Start").Width = 32
	.Columns.Add("End")
	var_s = "((1:=int(0:= (date(%1)-date(%0)))) != 0 ? (=:1 + ' day(s)') : '') + (=:1 ? ' ' : '' ) + ((1:=int(0:=((=:0 - =:1 + 1/24/60/60/2)*"
	var_s = var_s + "24))) != 0 ? =:1 + ' hour(s) ' : '' ) + ((1:=round((=:0 - =:1)*60)) != 0 ? =:1 + ' min(s)' : '')"
	.Columns.Add("Duration").ComputedField = var_s
	with .Items
		h = .AddItem({^2001-1-11})
		.CellValue(h,1) = {^2001-1-14}
		h = .AddItem({^2002-2-22 12:00:00})
		.CellValue(h,1) = {^2002-3-14 13:00:00}
		h = .AddItem({^2003-3-13})
		.CellValue(h,1) = {^2003-4-11 11:00:00}
	endwith
endwith
|
|
832
|
Is there a function to display the number of days between two date including the number of hours
with thisform.G2antt1
	.Columns.Add("Start")
	.Columns.Add("End")
	.Columns.Add("Duration").ComputedField = ""+chr(34)+"D "+chr(34)+" + int(date(%1)-date(%0)) + "+chr(34)+" H "+chr(34)+" + round(24*(date(%1)-date(%0) - floor(date(%1)-date(%0))))"
	with .Items
		h = .AddItem({^2001-1-11})
		.CellValue(h,1) = {^2001-1-14 23:00:00}
		h = .AddItem({^2002-2-22 12:00:00})
		.CellValue(h,1) = {^2002-3-14 13:00:00}
		h = .AddItem({^2003-3-13})
		.CellValue(h,1) = {^2003-4-11 11:00:00}
	endwith
endwith
|
|
831
|
How can I display the number of days between two dates
with thisform.G2antt1
	.Columns.Add("Start")
	.Columns.Add("End")
	.Columns.Add("Duration").ComputedField = "(date(%1)-date(%0)) + ' days'"
	with .Items
		h = .AddItem({^2001-1-11})
		.CellValue(h,1) = {^2001-1-14}
		h = .AddItem({^2002-2-22})
		.CellValue(h,1) = {^2002-3-14}
		h = .AddItem({^2003-3-13})
		.CellValue(h,1) = {^2003-4-11}
	endwith
endwith
|
|
830
|
How can I get second part of the date
with thisform.G2antt1
	.Columns.Add("Date")
	.Columns.Add("Second").ComputedField = "sec(date(%0))"
	with .Items
		.AddItem({^2001-1-11 10:10:00})
		.AddItem({^2002-2-22 11:01:22})
		.AddItem({^2003-3-13 12:23:01})
		.AddItem({^2004-4-14 13:11:59})
	endwith
endwith
|
|
829
|
How can I get minute part of the date
with thisform.G2antt1
	.Columns.Add("Date")
	.Columns.Add("Minute").ComputedField = "min(date(%0))"
	with .Items
		.AddItem({^2001-1-11 10:10:00})
		.AddItem({^2002-2-22 11:01:00})
		.AddItem({^2003-3-13 12:23:00})
		.AddItem({^2004-4-14 13:11:00})
	endwith
endwith
|
|
828
|
How can I check the hour part only so I know it was afternoon
with thisform.G2antt1
	.ConditionalFormats.Add("hour(%0)>=12").Bold = .T.
	.Columns.Add("Date")
	.Columns.Add("Hour").ComputedField = "hour(%0)"
	with .Items
		.AddItem({^2001-1-11 10:00:00})
		.AddItem({^2002-2-22 11:00:00})
		.AddItem({^2003-3-13 12:00:00})
		.AddItem({^2004-4-14 13:00:00})
	endwith
endwith
|
|
827
|
What about a function to get the day in the week, or days since Sunday
with thisform.G2antt1
	.Columns.Add("Date")
	.Columns.Add("WeekDay").ComputedField = "weekday(%0)"
	with .Items
		.AddItem({^2001-1-11 10:00:00})
		.AddItem({^2002-2-22 11:00:00})
		.AddItem({^2003-3-13 12:00:00})
		.AddItem({^2004-4-14 13:00:00})
	endwith
endwith
|
|
826
|
Is there any function to get the day of the year or number of days since January 1st
with thisform.G2antt1
	.Columns.Add("Date")
	.Columns.Add("Day since January 1st").ComputedField = "yearday(%0)"
	with .Items
		.AddItem({^2001-1-11 10:00:00})
		.AddItem({^2002-2-22 11:00:00})
		.AddItem({^2003-3-13 12:00:00})
		.AddItem({^2004-4-14 13:00:00})
	endwith
endwith
|
|
825
|
How can I display only the day of the date
with thisform.G2antt1
	.Columns.Add("Date")
	.Columns.Add("Day").ComputedField = "day(%0)"
	with .Items
		.AddItem({^2001-1-11 10:00:00})
		.AddItem({^2002-2-22 11:00:00})
		.AddItem({^2003-3-13 12:00:00})
		.AddItem({^2004-4-14 13:00:00})
	endwith
endwith
|
|
824
|
How can I display only the month of the date
with thisform.G2antt1
	.Columns.Add("Date")
	.Columns.Add("Month").ComputedField = "month(%0)"
	with .Items
		.AddItem({^2001-1-1 10:00:00})
		.AddItem({^2002-2-2 11:00:00})
		.AddItem({^2003-3-3 12:00:00})
		.AddItem({^2004-4-4 13:00:00})
	endwith
endwith
|
|
823
|
How can I get only the year part from a date expression
with thisform.G2antt1
	.Columns.Add("Date")
	.Columns.Add("Year").ComputedField = "year(%0)"
	with .Items
		.AddItem({^2001-1-1 10:00:00})
		.AddItem({^2002-2-2 11:00:00})
		.AddItem({^2003-3-3 12:00:00})
		.AddItem({^2004-4-4 13:00:00})
	endwith
endwith
|
|
822
|
Can I convert the expression to date
with thisform.G2antt1
	.Columns.Add("Number")
	.Columns.Add("Date").ComputedField = "date(dbl(%0))"
	with .Items
		.AddItem("-1.98")
		.AddItem("30000.99")
		.AddItem("3561.23")
		.AddItem("1232.34")
	endwith
endwith
|
|
821
|
Can I convert the expression to a number, double or float
with thisform.G2antt1
	.Columns.Add("Number")
	.Columns.Add("Number + 2").ComputedField = "dbl(%0)+2"
	with .Items
		.AddItem("-1.98")
		.AddItem("0.99")
		.AddItem("1.23")
		.AddItem("2.34")
	endwith
endwith
|
|
820
|
How can I display dates in long format
with thisform.G2antt1
	.Columns.Add("Date")
	.Columns.Add("LongFormat").ComputedField = "longdate(%0)"
	with .Items
		.AddItem({^2001-1-1 10:00:00})
		.AddItem({^2002-2-2 11:00:00})
		.AddItem({^2003-3-3 12:00:00})
		.AddItem({^2004-4-4 13:00:00})
	endwith
endwith
|
|
819
|
How can I display dates in short format
with thisform.G2antt1
	.Columns.Add("Date")
	.Columns.Add("ShortFormat").ComputedField = "shortdate(%0)"
	with .Items
		.AddItem({^2001-1-1 10:00:00})
		.AddItem({^2002-2-2 11:00:00})
		.AddItem({^2003-3-3 12:00:00})
		.AddItem({^2004-4-4 13:00:00})
	endwith
endwith
|
|
818
|
How can I display the time only of a date expression
with thisform.G2antt1
	.Columns.Add("Date")
	.Columns.Add("Time").ComputedField = "'time is:' + time(date(%0))"
	with .Items
		.AddItem({^2001-1-1 10:00:00})
		.AddItem({^2002-2-2 11:00:00})
		.AddItem({^2003-3-3 12:00:00})
		.AddItem({^2004-4-4 13:00:00})
	endwith
endwith
|
|
817
|
Is there any function to display currencies, or money formatted as in the control panel
with thisform.G2antt1
	.Columns.Add("Number")
	.Columns.Add("Currency").ComputedField = "currency(dbl(%0))"
	with .Items
		.AddItem(1.23)
		.AddItem(2.34)
		.AddItem(10000.99)
	endwith
endwith
|
|
816
|
How can I convert the expression to a string so I can look into the date string expression for month's name
with thisform.G2antt1
	.Columns.Add("Number")
	.Columns.Add("Str").ComputedField = "str(%0) + ' AA'"
	with .Items
		.AddItem("-1.98")
		.AddItem("0.99")
		.AddItem("1.23")
		.AddItem("2.34")
	endwith
endwith
|
|
815
|
Can I display the absolute value or positive part of the number
with thisform.G2antt1
	.Columns.Add("Number")
	.Columns.Add("Abs").ComputedField = "abs(%0)"
	with .Items
		.AddItem("-1.98")
		.AddItem("0.99")
		.AddItem("1.23")
		.AddItem("2.34")
	endwith
endwith
|
|
814
|
Is there any function to get largest number with no fraction part that is not greater than the value
with thisform.G2antt1
	.Columns.Add("Number")
	.Columns.Add("Floor").ComputedField = "floor(%0)"
	with .Items
		.AddItem("-1.98")
		.AddItem("0.99")
		.AddItem("1.23")
		.AddItem("2.34")
	endwith
endwith
|
|
813
|
Is there any function to round the values base on the .5 value
with thisform.G2antt1
	.Columns.Add("Number")
	.Columns.Add("Round").ComputedField = "round(%0)"
	with .Items
		.AddItem("-1.98")
		.AddItem("0.99")
		.AddItem("1.23")
		.AddItem("2.34")
	endwith
endwith
|
|
812
|
How can I get or display the integer part of the cell
with thisform.G2antt1
	.Columns.Add("Number")
	.Columns.Add("Int").ComputedField = "int(%0)"
	with .Items
		.AddItem("-1.98")
		.AddItem("0.99")
		.AddItem("1.23")
		.AddItem("2.34")
	endwith
endwith
|
|
811
|
How can I display names as proper ( first leter of the word must be in uppercase, and the rest in lowercase )
with thisform.G2antt1
	.Columns.Add("").FormatColumn = "proper(%0)"
	with .Items
		h = .AddItem("root")
		.InsertItem(h,Null,"child child")
		.InsertItem(h,Null,"child child")
		.InsertItem(h,Null,"child child")
		.ExpandItem(h) = .T.
	endwith
endwith
|
|
810
|
Is there any option to display cells in uppercase
with thisform.G2antt1
	.Columns.Add("").FormatColumn = "upper(%0)"
	with .Items
		h = .AddItem("Root")
		.InsertItem(h,Null,"Child 1")
		.InsertItem(h,Null,"Child 2")
		.InsertItem(h,Null,"Chld 3")
		.ExpandItem(h) = .T.
	endwith
endwith
|
|
809
|
Is there any option to display cells in lowercase
with thisform.G2antt1
	.Columns.Add("").FormatColumn = "lower(%0)"
	with .Items
		h = .AddItem("Root")
		.InsertItem(h,Null,"Child 1")
		.InsertItem(h,Null,"Child 2")
		.InsertItem(h,Null,"Chld 3")
		.ExpandItem(h) = .T.
	endwith
endwith
|
|
808
|
How can I mark the cells that has a specified type, ie strings only
with thisform.G2antt1
	.ConditionalFormats.Add("type(%0) = 8").ForeColor = RGB(255,0,0)
	.Columns.Add("")
	with .Items
		h = .AddItem("Root")
		.InsertItem(h,Null,"Child 1")
		.InsertItem(h,Null,2)
		.InsertItem(h,Null,"Chld 3")
		.ExpandItem(h) = .T.
	endwith
endwith
|
|
807
|
How can I bold the items that contains data or those who displays empty strings
with thisform.G2antt1
	.ConditionalFormats.Add("not len(%1)=0").Bold = .T.
	.Columns.Add("C1")
	.Columns.Add("C2")
	with .Items
		h = .AddItem("Root")
		.InsertItem(h,Null,"Child 1")
		hC = .InsertItem(h,Null,"Child 2")
		.CellValue(hC,1) = "1"
		.InsertItem(h,Null,"Child 3")
		.ExpandItem(h) = .T.
	endwith
endwith
|
|
806
|
Can I change the background color for items or cells that contains a specified string
with thisform.G2antt1
	.ConditionalFormats.Add("%0 contains 'hi'").BackColor = RGB(255,0,0)
	.Columns.Add("")
	with .Items
		h = .AddItem("Root")
		.InsertItem(h,Null,"Child 1")
		.InsertItem(h,Null,"Child 2")
		.InsertItem(h,Null,"Chld 3")
		.ExpandItem(h) = .T.
	endwith
endwith
|
|
805
|
Is there any option to change the fore color for cells or items that ends with a specified string
with thisform.G2antt1
	.ConditionalFormats.Add("%0 endwith '22'").ForeColor = RGB(255,0,0)
	.Columns.Add("")
	with .Items
		h = .AddItem("Root")
		.InsertItem(h,Null,"Child 1")
		.InsertItem(h,Null,"Child 1.22")
		.InsertItem(h,Null,"Child 2.22")
		.ExpandItem(h) = .T.
	endwith
endwith
|
|
804
|
How can I highlight the cells or items that starts with a specified string
with thisform.G2antt1
	.ConditionalFormats.Add("%0 startwith 'C'").Underline = .T.
	.Columns.Add("")
	with .Items
		h = .AddItem("Root")
		.InsertItem(h,Null,"Child 1")
		.InsertItem(h,Null,"Child 2")
		.InsertItem(h,Null,"SChild 3")
		.ExpandItem(h) = .T.
	endwith
endwith
|
|
803
|
How can I change the background color or the visual appearance using ebn for a particular column
with thisform.G2antt1
	.VisualAppearance.Add(1,"c:\exontrol\images\normal.ebn")
	with .Columns
		.Add("Column 1")
		.Add("Column 2").Def(7) = 16777216
		.Add("Column 3").Def(7) = 16777471
		.Add("Column 4")
	endwith
endwith
|
|
802
|
How can I change the foreground color for a particular column
with thisform.G2antt1
	with .Columns
		.Add("Column 1")
		.Add("Column 2").Def(8) = 8439039
		.Add("Column 3")
	endwith
endwith
|
|
801
|
How can I change the background color for a particular column
with thisform.G2antt1
	with .Columns
		.Add("Column 1")
		.Add("Column 2").Def(7) = 8439039
		.Add("Column 3")
	endwith
endwith
|